
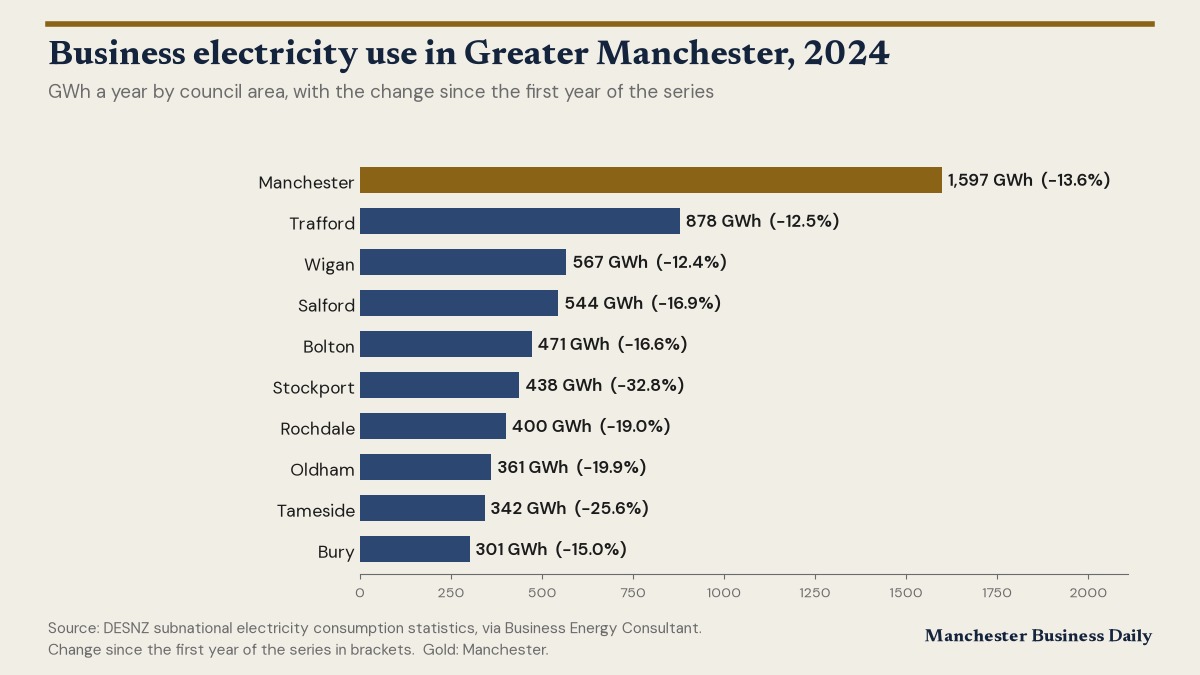
Businesses and other organisations in Manchester used 1,597 GWh of electricity in 2024 across 18,510 business meters, according to Department for Energy Security and Net Zero figures. That is 13.6% less than in 2012 and 0.6% less than in 2023.
The average Manchester business meter used 86,301 kWh, against a Great Britain average of 61,524 kWh. Manchester ranks first of 35 council areas in the North West by business electricity use.
Across Greater Manchester, the 10 council areas used 5,899 GWh between them. Every one of them used less than in its first year in the series: the smallest fall was in Wigan (12.4%) and the biggest in Stockport (32.8%).
On prices, the smallest businesses in Great Britain, using up to 20 MWh a year, paid an average of 38.36p per kWh for electricity in Q2 2026, the highest in the government series, which starts in 2004. Firms using 20 to 499 MWh paid 28.59p and the very largest users, over 150,000 MWh, paid 22.25p. At the smallest firms’ rate, every 1,000 kWh costs £383.60 before VAT.
How the figures were worked out
Electricity use comes from the Department for Energy Security and Net Zero’s subnational electricity consumption statistics for 2024, the latest year published, on current council boundaries. Non-domestic means businesses and other organisations, including public buildings. Use per meter is total consumption divided by the number of meters. Prices come from the department’s Quarterly Energy Prices, table 3.4.2, published 29 September 2026: they are average prices actually paid across Great Britain, including the Climate Change Levy and excluding VAT, and Q2 2026 figures are provisional. They are national averages by business size, not prices for Manchester. Figures compiled by Business Energy Consultant.
Manchester’s figures, with a chart since 2012: Business Energy Consultant: business electricity use in Manchester.
Chart: Manchester Business Daily, from Department for Energy Security and Net Zero figures.
Business Energy Consultant, which offers business energy quotes, is published by Domain Farm Limited, which also publishes Manchester Business Daily.